
CAC, Payback, Channel Quality. The Report Writes Itself.
The three numbers your board asks for every meeting are still assembled by hand, in a spreadsheet, the week before the call. The board metrics pack connects your ad platforms, CRM, and product data so those numbers compute automatically. $3,000-$6,000 setup. The report writes itself.
AI Growth Systems: the operating layer between your ads account and your bank account. I don't rent you ChatGPT. I install a growth machine.
Board metrics that compute from live data, not a spreadsheet
"A board deck should read like a P&L for growth: CAC, payback, and channel quality straight from the warehouse, not a guess assembled the night before the meeting."
Yaniv Goldenberg, fractional growth operator
CAC payback and efficiency benchmarks: Bessemer Cloud Atlas.
A board metrics pack is a connected data system that computes the three numbers boards actually ask for: customer acquisition cost by channel, payback period by cohort, and channel quality (cost per dollar of qualified pipeline). It pulls from your ad platforms, CRM, and product data on a schedule. The report pre-populates itself.
AI Growth Systems is the operating layer between your ads account and your bank account. The board metrics pack is where that layer becomes fundable: clean, sourced numbers your board can underwrite without a follow-up data request.
$3,000-$6,000 build. Light monthly retain optional.
Who the board metrics pack is built for
Right fit for the board metrics pack:
Series A or B company preparing for a board meeting or fundraise
Growth team that spends more than 4 hours assembling board metrics each cycle
Company where CAC lives in five different spreadsheets with five different answers
CEO who wants to show the board channel quality, not just blended ROAS
Teams where payback period is calculated quarterly by hand instead of tracked live
Not the right fit:
Pre-revenue or pre-PMF: no acquisition data to compute
Attribution is broken and unresolved: clean that first (diagnostic sprint)
No CRM or event tracking: the pack connects data that already exists
Looking for a BI tool or data warehouse build: this is a metrics layer, not a full platform
Free boards or pre-seed without institutional investors: not the buyer for this
Six deliverables from metric lock to board brief
Metric definitions document
CAC formula locked with the team: what counts as an acquisition cost, which channels are blended vs separated, how CRM closed-won maps to ad attribution. Board-reviewed once. Never debated again at a board meeting.
Live data pipeline
n8n pipeline pulling from ad platforms, CRM, and product data on a daily or weekly schedule. No manual exports. No spreadsheet assembly. Numbers are there when you open the dashboard.
CAC by channel and cohort
Blended CAC, CAC by channel, and CAC by cohort month. The board sees which channels are getting more expensive before a growth problem shows up in the headline number.
Payback period live
Months-to-payback computed from acquisition cost and revenue recognition data. Updated with each closed deal. A funded startup knows its payback curve in real time, not once a quarter after someone runs a spreadsheet.
Channel quality score
Cost per qualified pipeline dollar by channel. Separates volume from quality: a channel that generates leads at low cost but closes at 3% is not the same as one that closes at 18%. The score shows both dimensions at once.
Board brief auto-template
A structured brief that pulls the week-before-board numbers into a pre-formatted document. The team reviews, adds narrative, and formats. The numbers section writes itself from the pipeline.
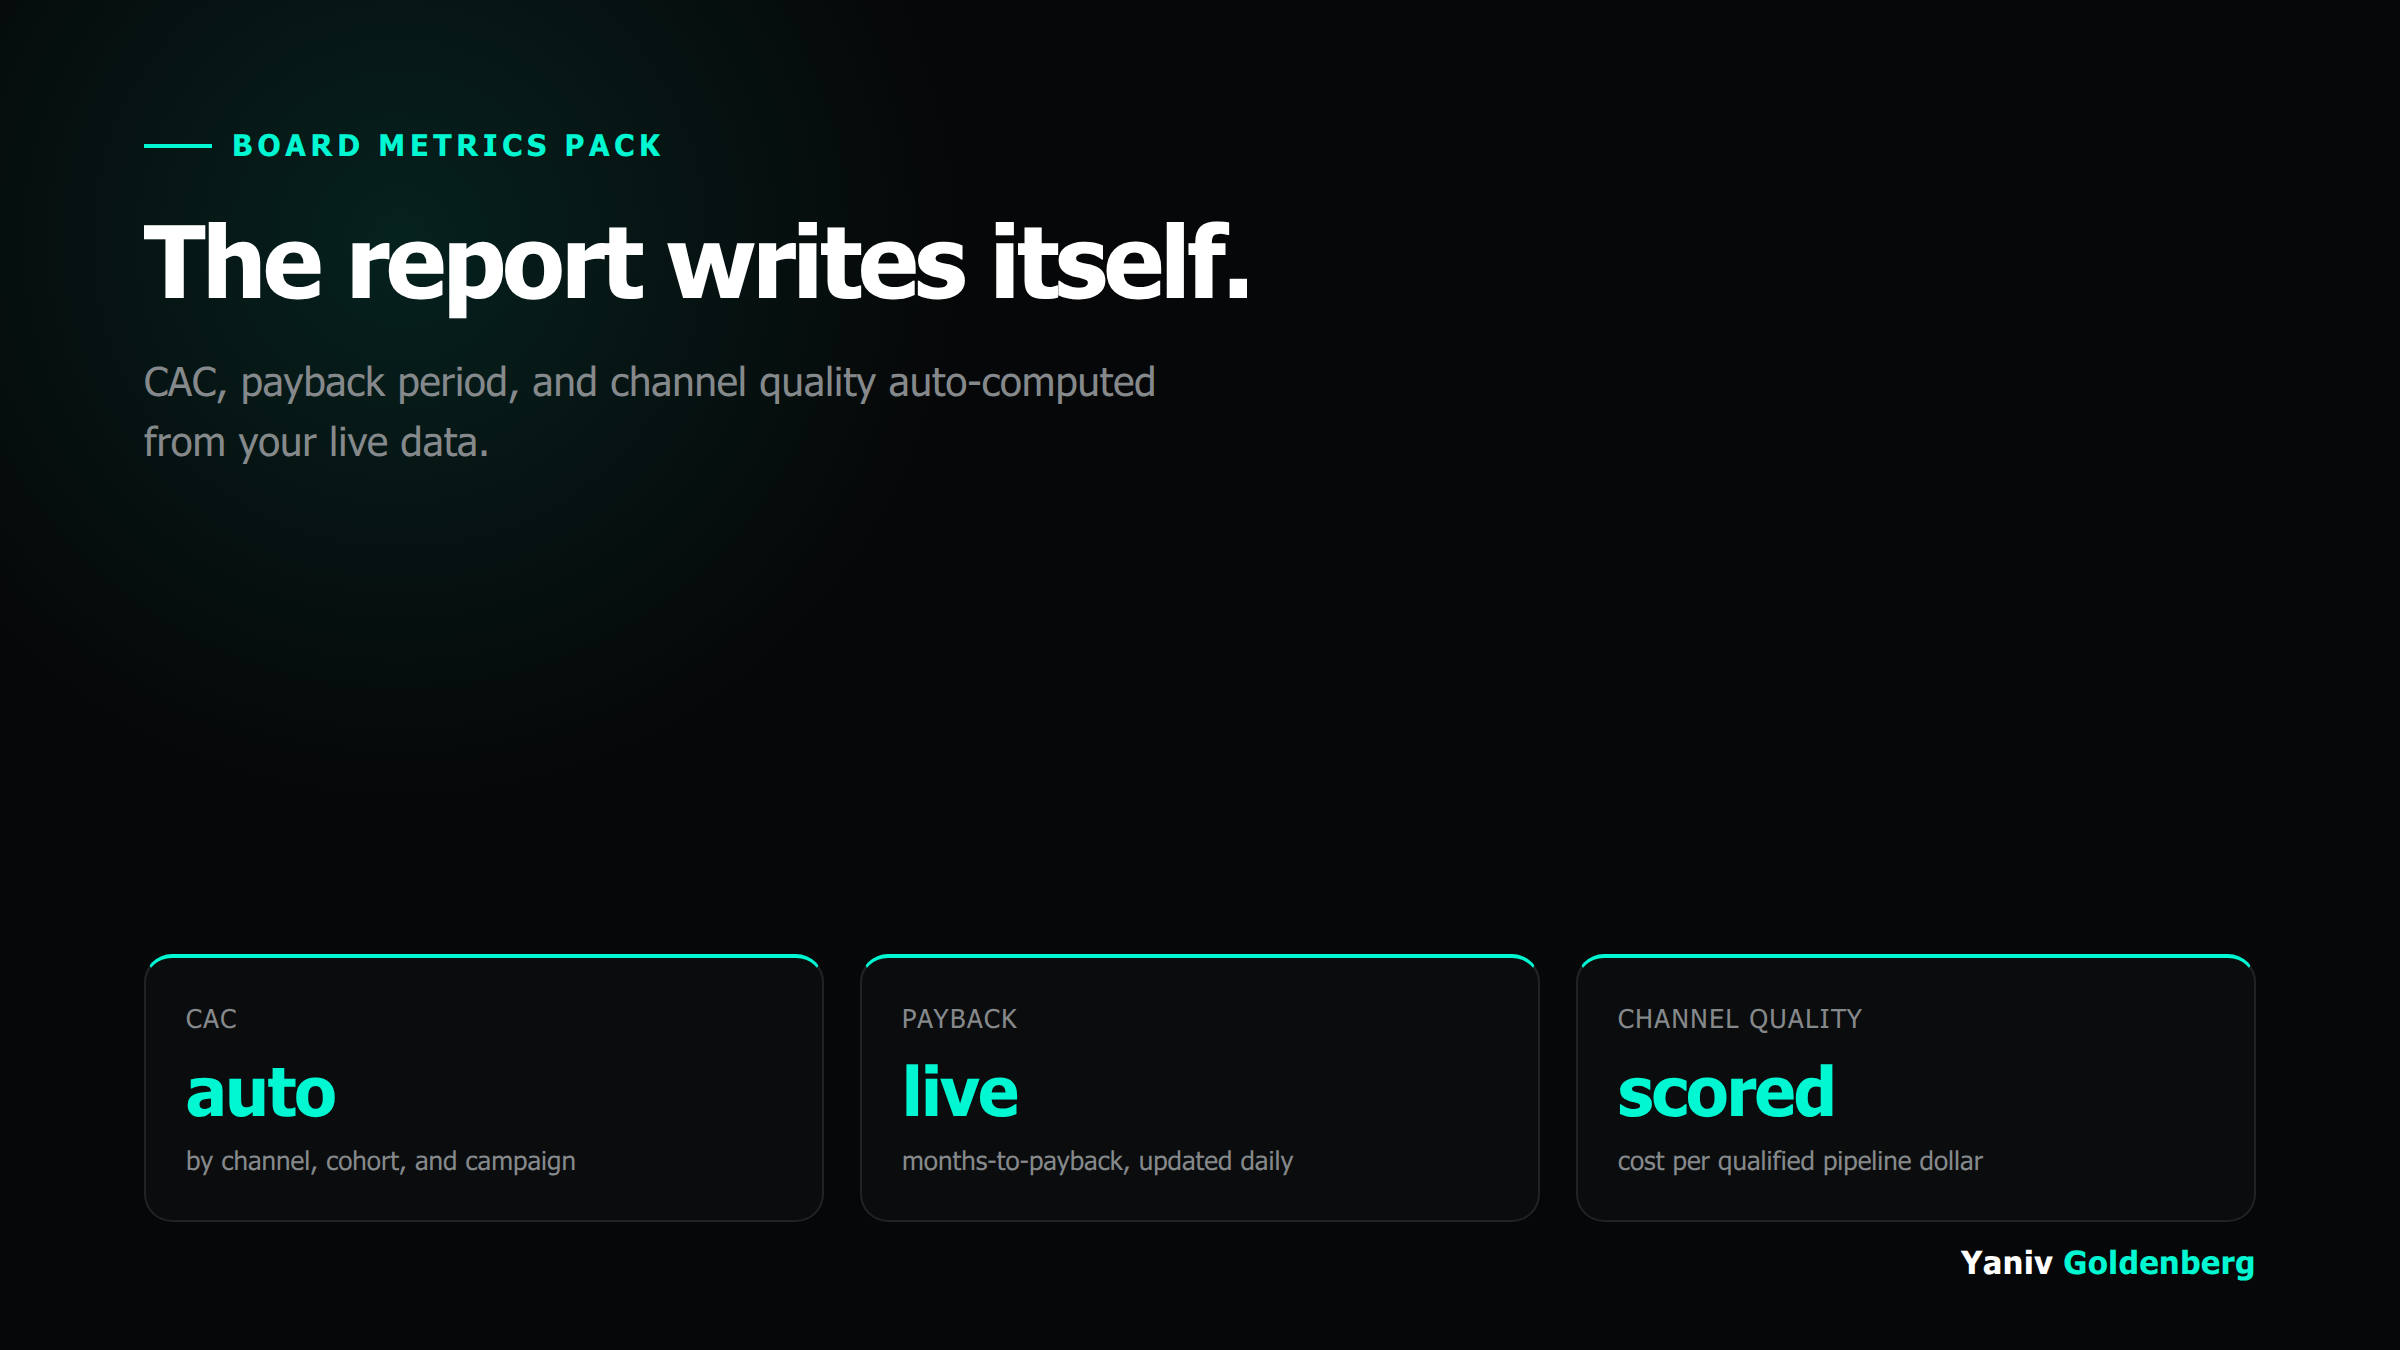
CAC, payback, and channel quality: auto-computed from your live stack
Week 1 to week 4: from data audit to live board brief
Data audit and metric lock
Audit every data source: ad platforms, CRM, billing, product events. Lock CAC definition, payback formula, and channel quality criteria with the team. Nothing gets built until the definitions are signed off.
Pipeline build and dashboard
n8n pipeline built, tested, and connected to all data sources. Dashboard live with real numbers. First run compared to your existing manual numbers to catch definition discrepancies before board exposure.
Brief template and handoff
Board brief template built against the pipeline. Live test with one real board cycle. Team trained on the review workflow. Retain scope agreed for ongoing maintenance if needed.
Attribution and metrics discipline at scale
Board metrics pack vs every other option on the table
| Option | What the board sees | The problem |
|---|---|---|
| Manual spreadsheet assembly | Numbers assembled the week before | 4-8 hours, error-prone, different answer every quarter |
| BI tool only | Raw data, self-serve | Someone still has to compute and frame CAC and payback |
| Add a data analyst | Custom queries on demand | $80-120K/yr for a role that spends half its time on this |
| Agency dashboard add-on | Platform vanity metrics | Blended CAC lives on their platform, not yours |
| Board metrics pack | Live CAC, payback, channel quality, auto-brief | None: designed for exactly this board prep problem |
Board metrics pack FAQ
What does 'auto-computed' actually mean?
It means your CAC, payback period, and channel quality numbers pull directly from your ad platform, CRM, and product database on a schedule. Nobody assembles a spreadsheet before the board meeting. The metrics are there when you open the dashboard. Human review happens at the end, not in the middle.
We already have a BI tool. Why do we need this?
BI tools show you data. The board metrics pack shows you decisions. The pack pre-computes the ratios your board actually asks for: blended CAC vs channel CAC, months-to-payback by cohort, channel quality score (cost per qualified pipeline). Most BI tools require a data analyst to produce that framing. This does it without one.
How long does setup take?
Three to four weeks for a standard stack. Week one: data audit and CRM event mapping. Weeks two and three: pipeline build, metric definitions locked with the team. Week four: dashboard live, brief template tested with a real board deck.
Which data sources does it connect?
Google Ads, Meta Ads, LinkedIn Ads, GA4, HubSpot, Salesforce, Stripe, and most major CRM and billing systems via n8n native connectors or a direct API. If your stack is non-standard, the data audit in week one maps what is feasible before scope is locked.
Do we need an engineer to maintain it after setup?
No. The system runs on n8n with a light monthly retain for data refresh and metric definition updates. If your CAC definition changes after a fundraise, I update the formula, not your dev team.
What if we already have someone building board decks manually?
Then they can stop doing that. The pack pre-populates the numbers section of the deck from live data. The analyst still writes narrative and runs QA, but they stop pulling numbers from five tabs and reconciling by hand. That usually saves one to two days per board cycle.
Where the board metrics pack fits in the AI Growth Systems catalog
Show me your board deck and your data sources
30 minutes to map which metrics are manual today, which data sources exist, and what a realistic build scope looks like for your stack. If the pack is the right fit, I'll send a scoped proposal the same week.